
Eastern Shore Real Estate Market Insights
Understand the market before you make a move.
Whether you're buying your first home on the Eastern Shore, searching for waterfront property, or preparing to sell, understanding today's market can help you make more confident decisions. Each month I break down local housing trends across Kent, Queen Anne's, Talbot, and Cecil Counties, giving you the context behind the numbers, not just the statistics.
Kent County, Maryland
October 2026 Market Snapshot
Median Sold Price
+9% vs. 2025
Homes Sold
-15% vs. 2025
Median Days on Market
+333% vs. 2025
Active Listings
+64% vs. 2025

What This Means for Kent County Buyers & Sellers
Kent's median came back up to $395,000 in October, up 9%, one month after dropping 16%. With only 23 homes selling, down 15% from last year, that swing says more about which homes happened to close than about values, the same pattern Kent has shown all fall. The steadier signal is supply. There are 146 active listings, up 64%, and the median home took 26 days to sell, compared with about six days last October, when nearly everything went under contract right away.
For sellers, buyers now have time to look, compare, and come back, so the first few weeks on the market are when pricing and presentation matter most. For buyers, Kent is still the most open market on the Shore, with inventory up by nearly two-thirds and a winter season ahead, when sellers who are still listed tend to be the most open to a real conversation about price.
Queen Anne's County, Maryland
October 2026 Market Snapshot
Median Sold Price
+2% vs. 2025
Homes Sold
+4% vs. 2025
Median Days on Market
+60% vs. 2025
Active Listings
+27% vs. 2025
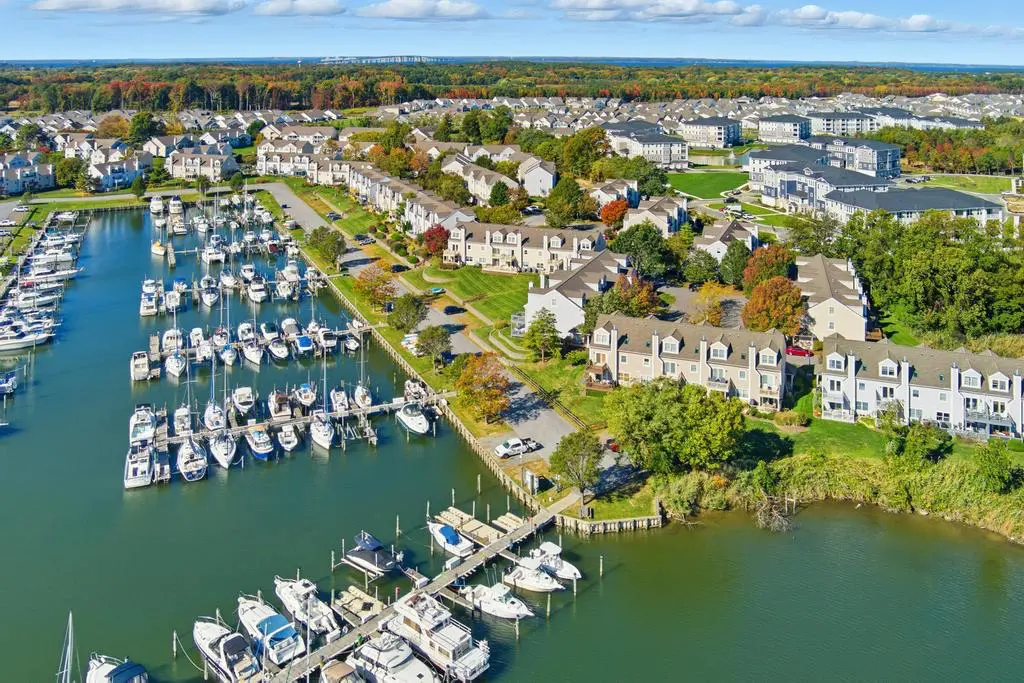
What This Means for Queen Anne's County Buyers & Sellers
Queen Anne's bounced back in October with 89 homes sold, up 4% from last year and a big jump from September's 58, making it the busiest county on the Shore this month. The median held steady at $555,000, up 2%, the highest of the four counties. Inventory kept building to 302 active listings, up 27%, and the median home took 40 days to sell, up from about 25 a year ago.
For sellers, the buyers are back, but they're taking their time, so plan on a longer runway than last fall and price against the homes you're actually competing with. For buyers, steady prices and more than 300 homes to choose from mean you can be thorough without losing out, which wasn't the case a year ago.
Talbot County, Maryland
October 2026 Market Snapshot
Median Sold Price
-16% vs. 2025
Homes Sold
-18% vs. 2025
Median Days on Market
-2% vs. 2025
Active Listings
+19% vs. 2025

What This Means for Talbot County Buyers & Sellers
Talbot's median fell to $477,450 in October, down 16%, one month after jumping 21% to $640,000. That back and forth is the clearest sign that Talbot's median follows the mix of homes closing each month, especially at the upper end and on the water, rather than a real shift in what homes are worth. Sales slowed to 40, down 18%, and the median home took 28 days to sell, up from about 16 a year ago. Inventory rose 11% to 273, still the smallest increase of the four counties.
For sellers, look at what's sold in your price band over the last few months rather than any single month's median, since a handful of waterfront closings can move that number by six figures. For buyers, Talbot's supply is growing more slowly than anywhere else on the Shore, so well-located homes still don't wait around for long.
Cecil County, Maryland
October 2026 Market Snapshot
Median Sold Price
+4% vs. 2025
Homes Sold
-2% vs. 2025
Median Days on Market
+19% vs. 2025
Active Listings
+28% vs. 2025

What This Means for Cecil County Buyers & Sellers
Cecil sold 84 homes in October, down 2% from last year and fewer than September's 104, but still close behind Queen Anne's for the most activity on the Shore. The median rose 4% to $365,000, and at 19 days, Cecil's median time on market is the fastest of the four counties. Inventory is climbing here too, up 28% to 301 active listings, nearly matching Queen Anne's.
For sellers, well-priced homes are still going under contract in under three weeks, so if yours hasn't, the market is likely telling you something about price. For buyers, especially first-time buyers, Cecil still has the lowest median of the four counties, but the right homes move quickly, so get pre-approved and know what you want before you start touring.
See What's Available Right Now
Curious how today's market translates into real homes? Browse a selection of Courtney's current listings to see what's available across Maryland's Eastern Shore.
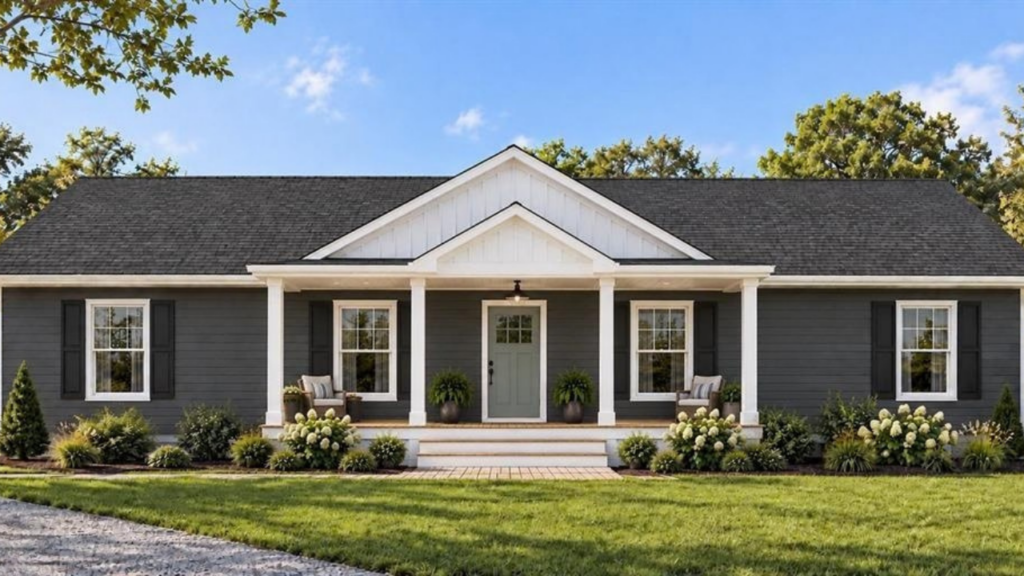
21008 Rock Hall Ave. Rock Hall, MD 21661
3 BD | 2 BA | 1,650 SQFT | .79 ACRES
$599,900
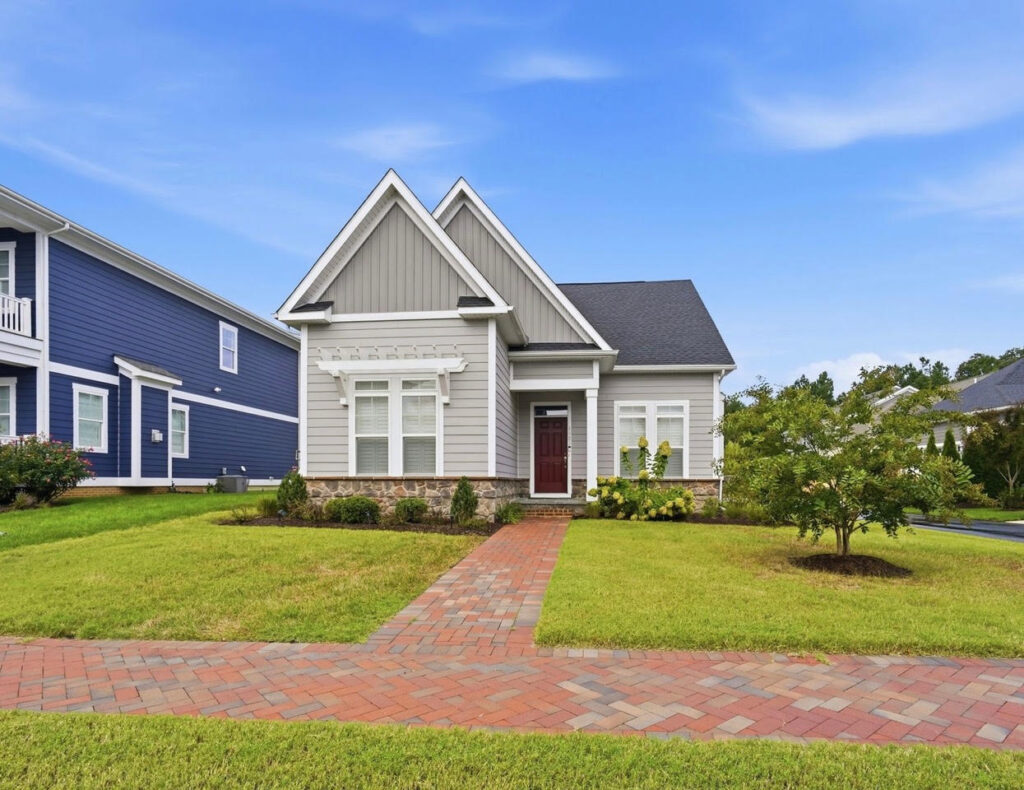
8082 Easton Village Dr. Easton, MD 21601
3 BD | 3 BA | 2,076 SQFT | .14 ACRES
$699,000
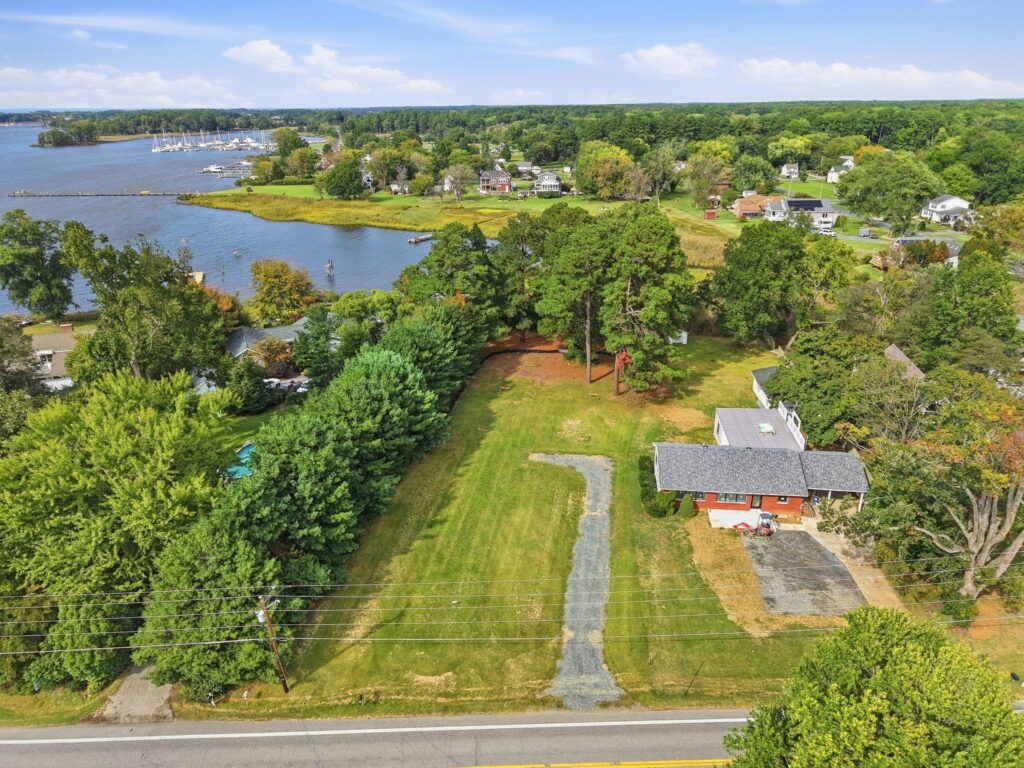
21008 Rock Hall Ave. Rock Hall, MD 21661
.79 ACRES
$155,000
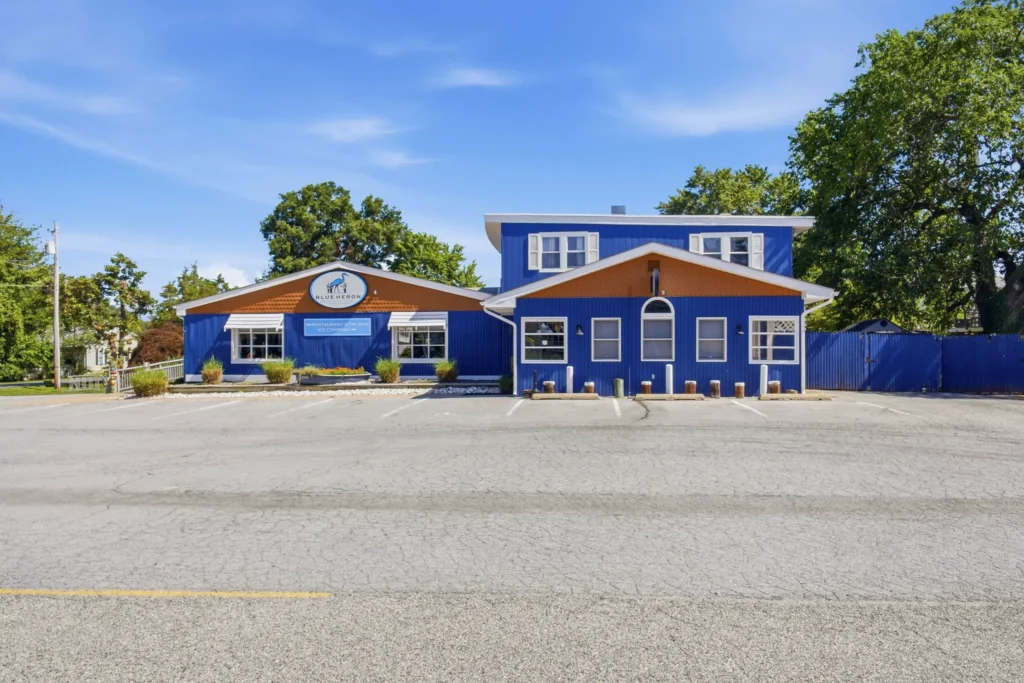
20658 Wilkins Ave. Rock Hall, MD 21661
BLUE HERON OYSTER HOUSE & INN
$1,500,000
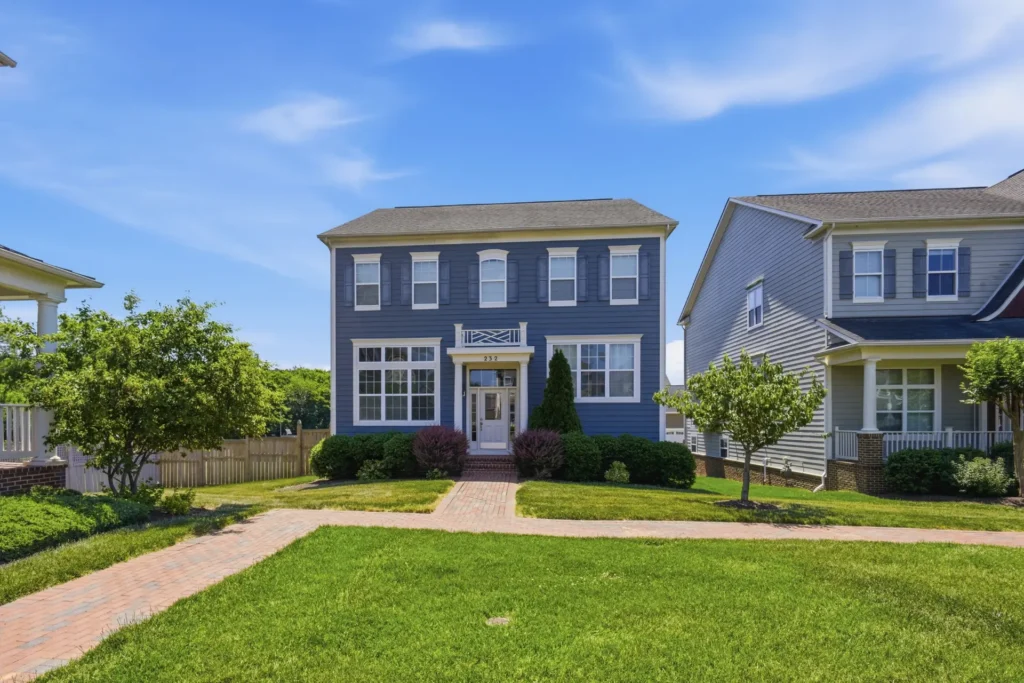
232 Evelyne St. Chester, MD
4 BD | 4 BA | 3,312 SQFT
$799,900

Real Estate Decisions Deserve More Than Market Statistics
County-wide data is a great starting point, but every neighborhood and every home has its own story. Courtney combines local market knowledge with current data to help buyers and sellers make confident decisions throughout Maryland's Eastern Shore.