
Eastern Shore Real Estate Market Insights
Understand the market before you make a move.
Whether you're buying your first home on the Eastern Shore, searching for waterfront property, or preparing to sell, understanding today's market can help you make more confident decisions. Each month I break down local housing trends across Kent, Queen Anne's, Talbot, and Cecil Counties, giving you the context behind the numbers, not just the statistics.
Kent County, Maryland
August 2026 Market Snapshot
Median Sold Price
-19% vs. 2025
Homes Sold
-13% vs. 2025
Average Days on Market
+57% vs. 2025
Active Listings
+78% vs. 2025

What This Means for Kent County Buyers & Sellers
Kent's median jumped to $410,000 in August, up 19%, one month after posting an 8% decline. With only 27 homes selling, the median swings on which properties happen to close, so neither number tells you much about values. What does: 141 active listings, up 78% from last August, and 66 days on market, up from about 42.
For sellers, Kent has meaningfully loosened. Nearly twice the competing inventory and homes taking two months to sell means the asking price has to be right on day one, because there's no longer a shortage of alternatives to fall back on. For buyers, Kent is the most open market on the Shore right now, with real choice and real negotiating room.
Queen Anne's County, Maryland
August 2026 Market Snapshot
Median Sold Price
+3% vs. 2025
Homes Sold
+8% vs. 2025
Average Days on Market
+2% vs. 2025
Active Listings
+13% vs. 2025
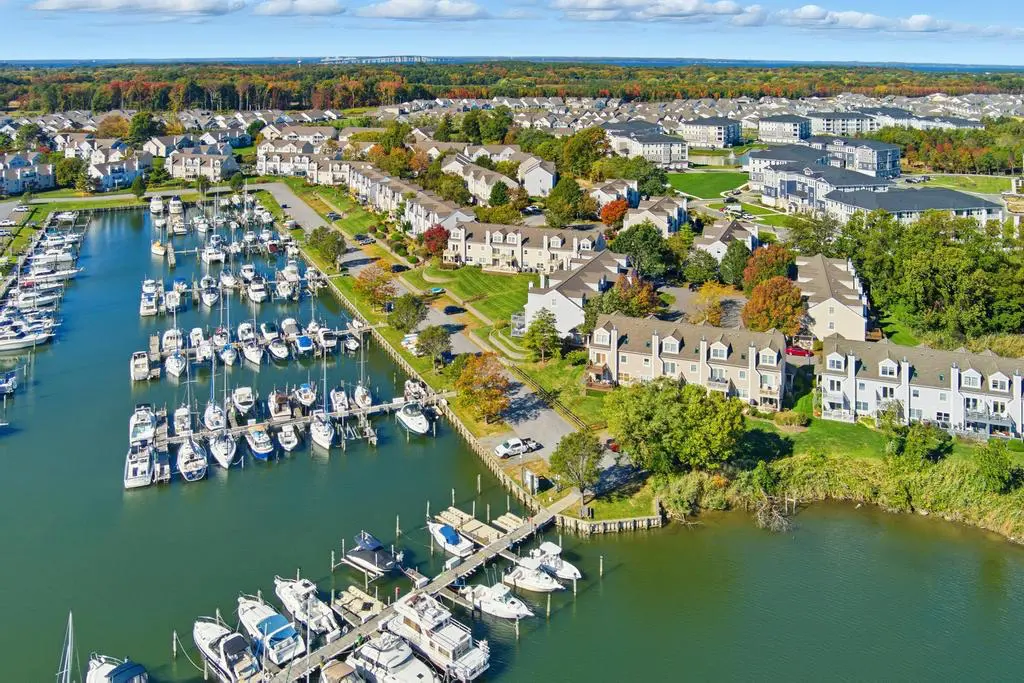
What This Means for Queen Anne's County Buyers & Sellers
After July's unusual spike, Queen Anne's settled back into a steady rhythm. The median came in at $565,000, up 3%, with 80 homes sold, up 8%, at 49 days on market, essentially flat year over year. Inventory grew 13%. That's a market doing all the normal things at once.
For sellers, this is a workable, predictable market. Homes are selling in about seven weeks at prices modestly ahead of last year, but the added inventory means presentation and pricing still decide which listings move. For buyers, more choice arrived without any loss of pace, which is the friendliest combination Queen Anne's has offered this year.
Talbot County, Maryland
August 2026 Market Snapshot
Median Sold Price
-22% vs. 2025
Homes Sold
+5% vs. 2025
Average Days on Market
-20% vs. 2025
Active Listings
+6% vs. 2025

What This Means for Talbot County Buyers & Sellers
Talbot's August median was $453,750, down 22%, and that number needs explaining. Homes sold faster in August, averaging 73 days against about 91 last year, and more of them closed, 68 versus 65. A market where sales rise and pace quickens is not a market where values are falling. What changed is which homes sold. Fewer high-end and waterfront closings in the mix pulls the median down without moving any individual home's worth.
For sellers, the takeaway is to ignore the county median and look at what's sold in your price band and your part of the county. For buyers, 243 active listings and a shorter average time to contract means more options that are moving, so the good ones won't wait for a second visit.
Cecil County, Maryland
August 2026 Market Snapshot
Median Sold Price
+16% vs. 2025
Homes Sold
-21% vs. 2025
Average Days on Market
+17% vs. 2025
Active Listings
+14% vs. 2025

What This Means for Cecil County Buyers & Sellers
Cecil cooled from July's pace but stayed the fastest market of the four. The median rose to $405,000, up 16%, while 79 homes sold, down 21%, at 35 days on market. Active listings grew 14% to 280.
Fewer sales alongside a higher median and more inventory suggests buyers took longer to commit in August while the homes that did close skewed toward the upper end. For sellers, 35 days is still quick by Shore standards, but the market is no longer absorbing everything that lists. For buyers, this is a better month than July was, with more to choose from and slightly more time to decide.
See What's Available Right Now
Curious how today's market translates into real homes? Browse a selection of Courtney's current listings to see what's available across Maryland's Eastern Shore.
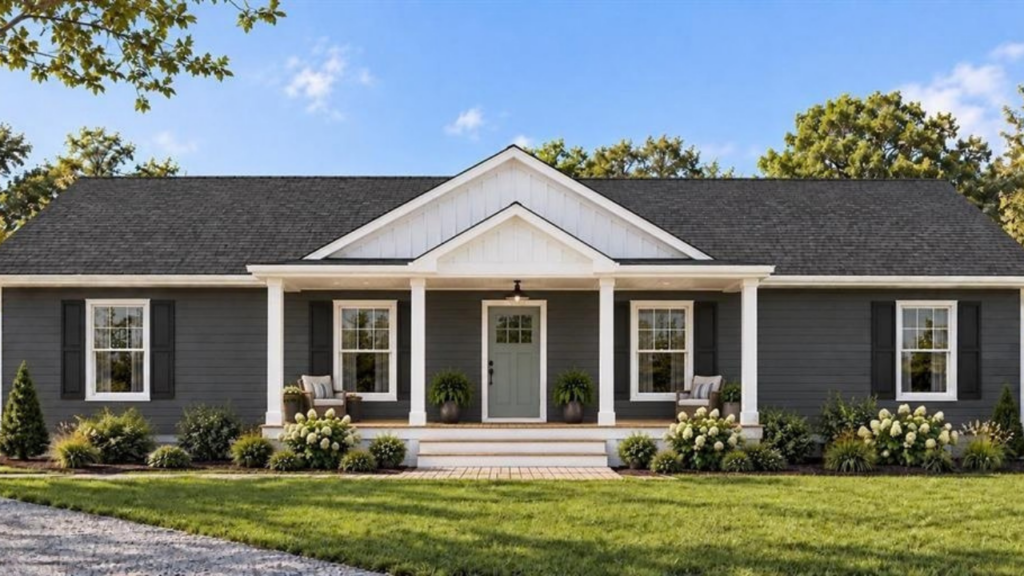
21008 Rock Hall Ave. Rock Hall, MD 21661
3 BD | 2 BA | 1,650 SQFT | .79 ACRES
$599,900
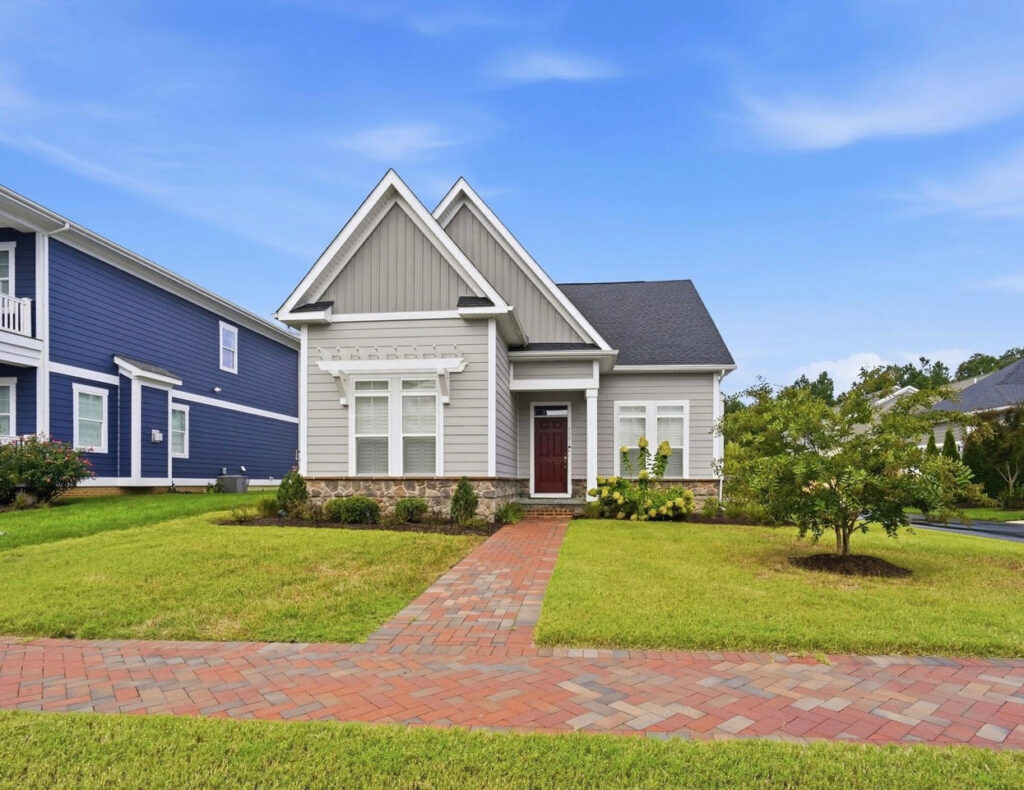
8082 Easton Village Dr. Easton, MD 21601
3 BD | 3 BA | 2,076 SQFT | .14 ACRES
$699,000
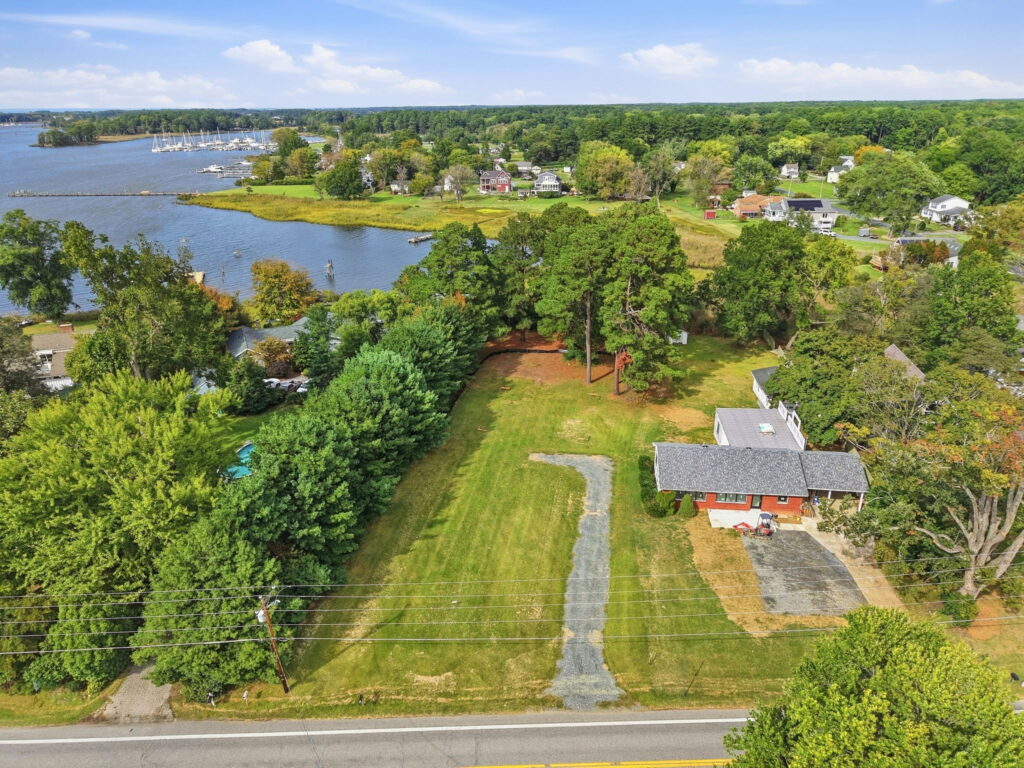
21008 Rock Hall Ave. Rock Hall, MD 21661
.79 ACRES
$155,000
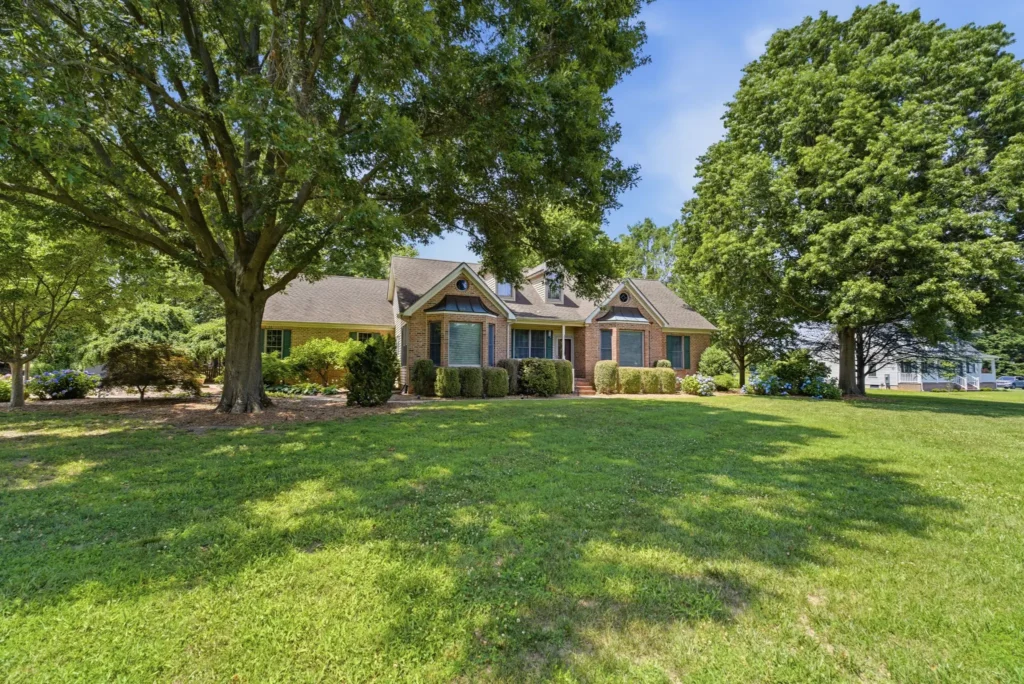
12200 Azalea Ct Worton, MD 21678
3 BD | 3 BA | 2,423 SQFT | 1.84 ACRES
$535,000
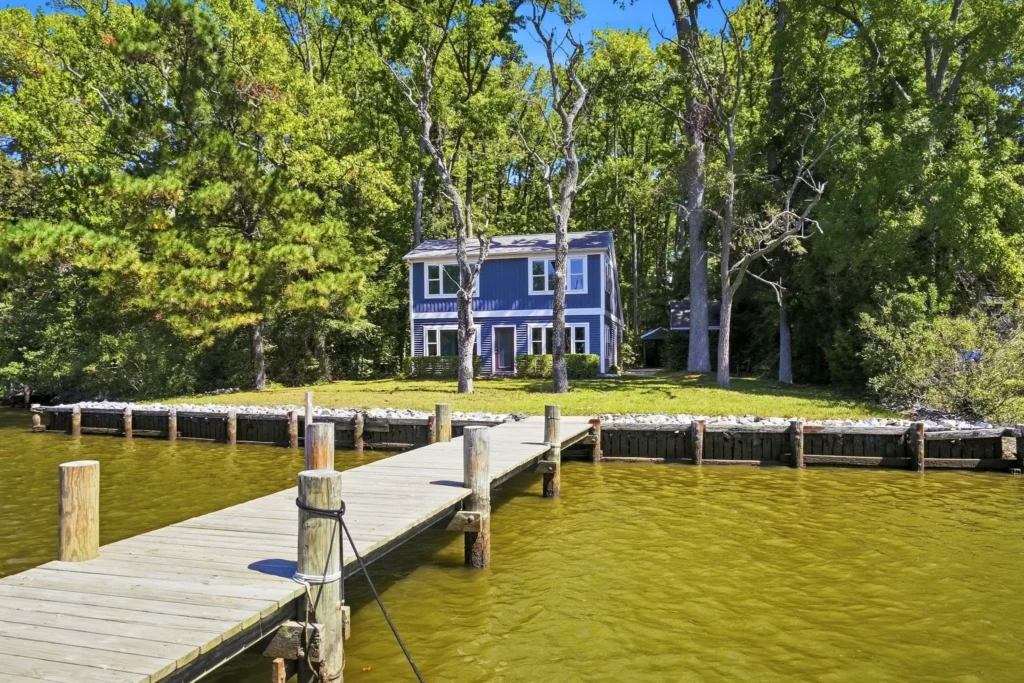
21728 Sunnyside Ave, Rock Hall, MD 21661
3 BD | 2 BA | 1,324 SQFT | .50 ACRES
$625,000
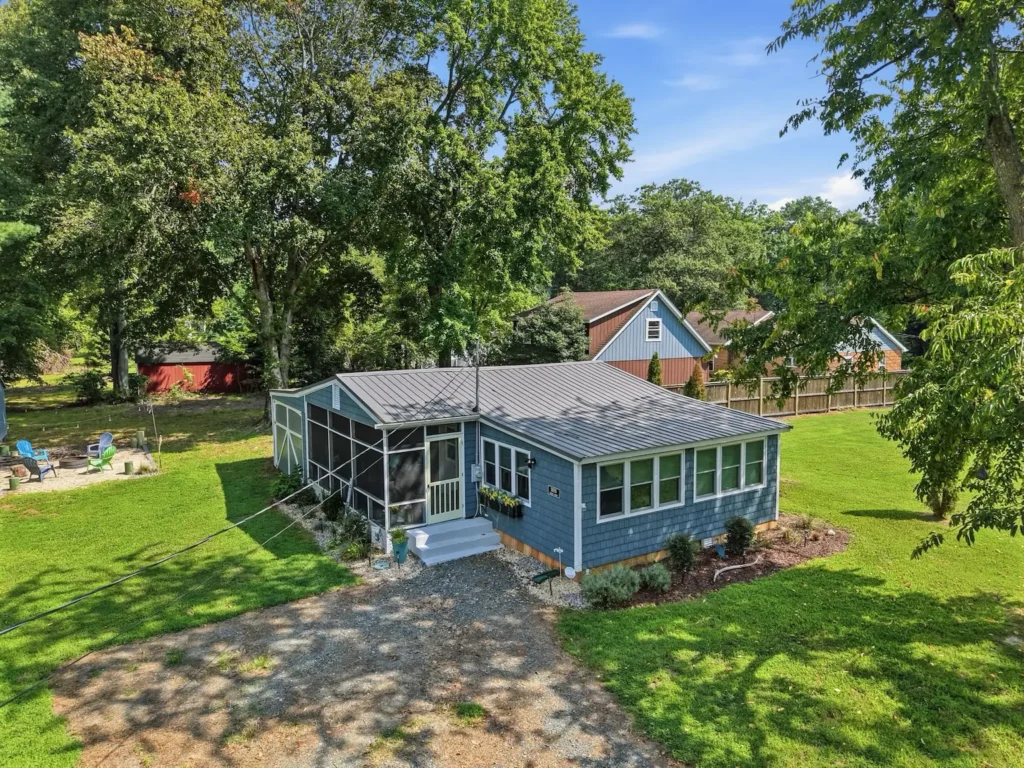
20705 Wilkins Ave. Rock Hall, MD 21661
4 BD | 1 BA | 926 SQFT | .31 ACRES
$320,000
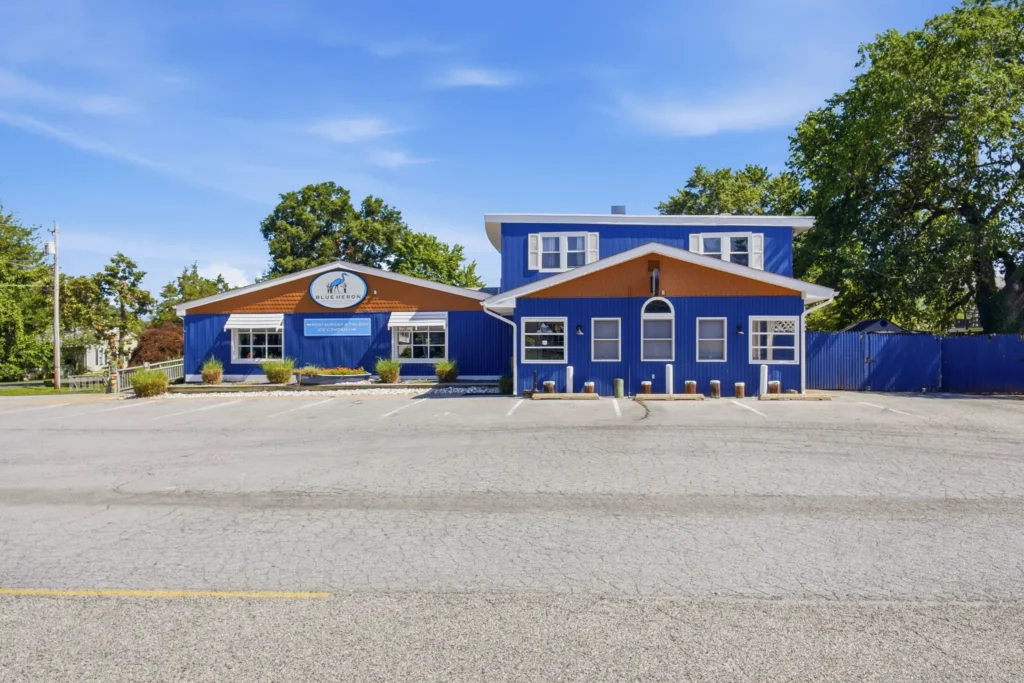
20658 Wilkins Ave. Rock Hall, MD 21661
BLUE HERON OYSTER HOUSE & INN
$1,500,000
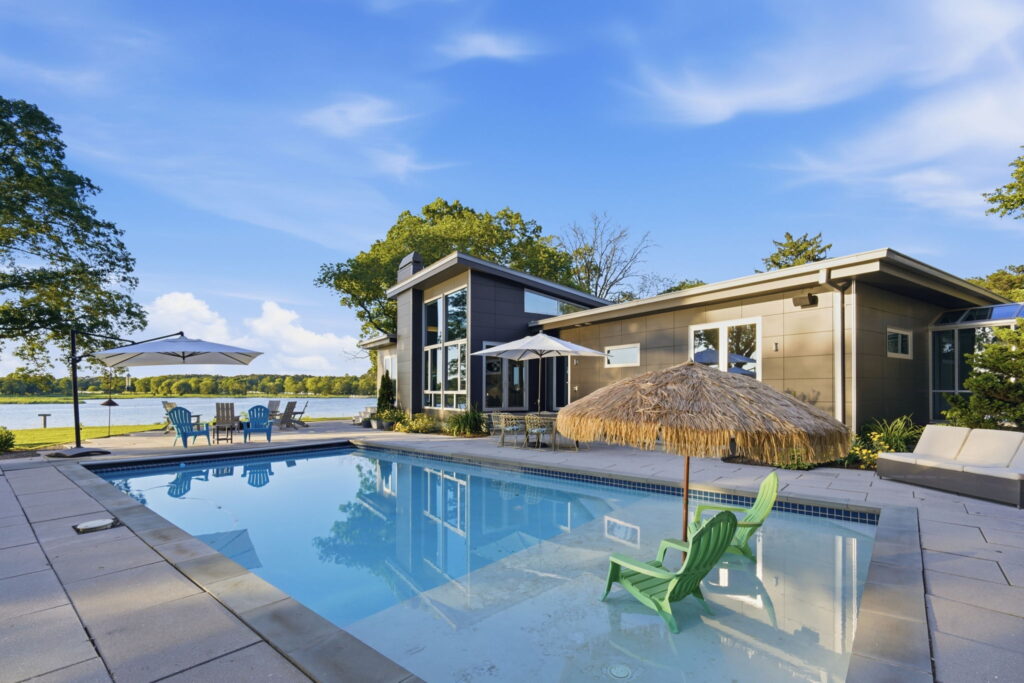
2800 Bennett Point Rd. Queenstown, MD 21658
5 BD | 4.5 BA | 6,156 SQFT | 17.97 ACRES
$4,695,000
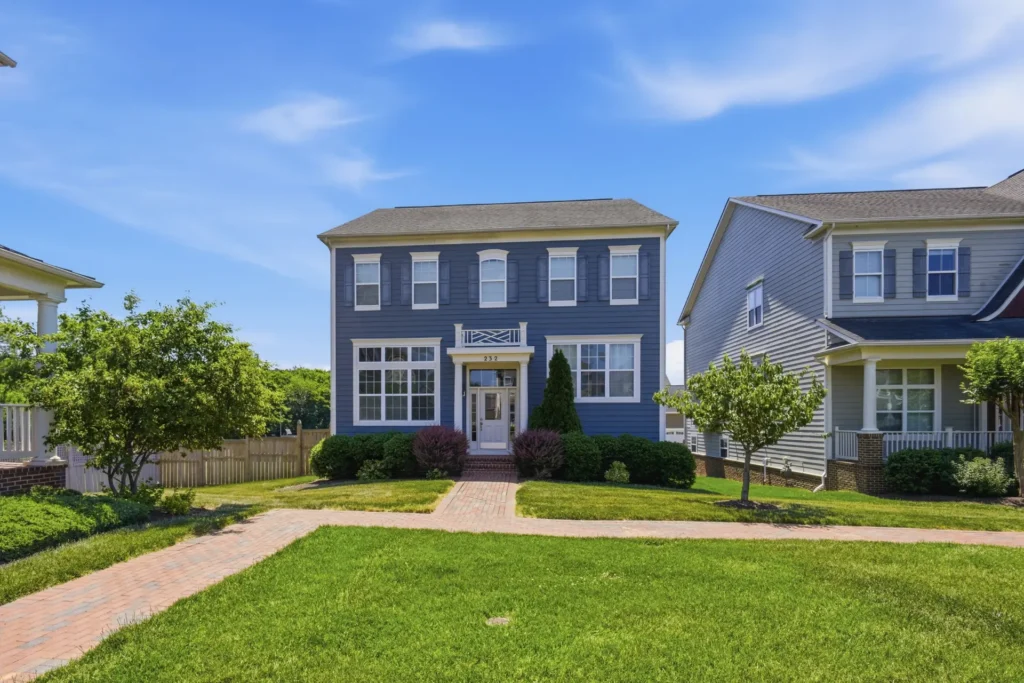
232 Evelyne St. Chester, MD
4 BD | 4 BA | 3,312 SQFT
$825,000

Real Estate Decisions Deserve More Than Market Statistics
County-wide data is a great starting point, but every neighborhood and every home has its own story. Courtney combines local market knowledge with current data to help buyers and sellers make confident decisions throughout Maryland's Eastern Shore.